BK101
Knowledge Base
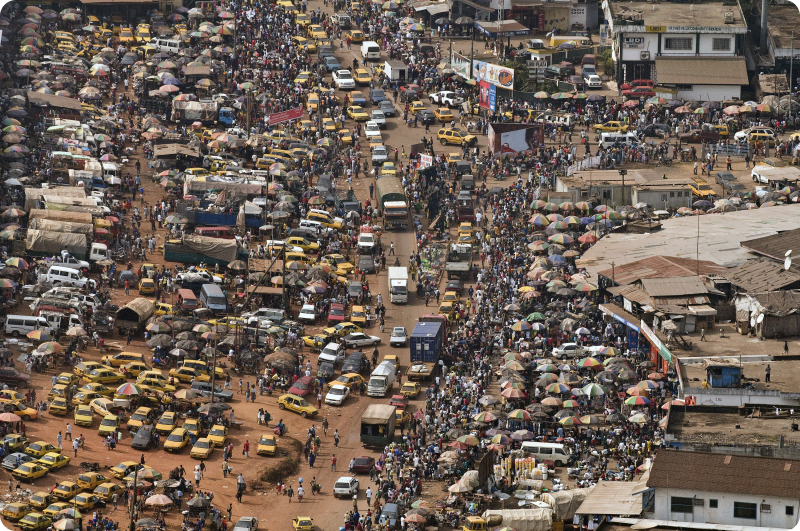
Populations
Population is the number of all the organisms of the same group or species, which live in a particular geographical area, and have the capability of interbreeding.
Demographics - Poverty - Walls - Causes of Death - How People Die - People Watching - City Planning
Current World Population
The current world population is 7.8 billion as of May 2020, 7.7 Billion as of March 2019. 7,600,000,000 in December, 2017 - In the next 100 years 7 billion people will die. How many people have lived since the beginning? How many people were born and died in my lifetime?
 Around 384 thousand people are
born everyday,
156 thousand die each day. That is a net increase of
229
thousand new people every single day or over
83 Million new people every year or
83,585,000 new people every year out of the 140.4 million that are born each
year. Four births each second
of every day and nearly two people die each second. 250 births each minute
and 105 people die each minute.
Around 384 thousand people are
born everyday,
156 thousand die each day. That is a net increase of
229
thousand new people every single day or over
83 Million new people every year or
83,585,000 new people every year out of the 140.4 million that are born each
year. Four births each second
of every day and nearly two people die each second. 250 births each minute
and 105 people die each minute.There are areas in the world where the population is declining because of low birth rates and from more old people dying of diseases. There are now more adult diapers sold than baby diapers in Japanese supermarkets. Over population depends on where you live and how the area is managed. Under population or demographic crunch can also be problematic when there are not enough service providers.
Carrying Capacity
Projections for the global population in 2050 - Each Country's Population compared with the World Population.
Census Population Details - Census Accuracy Problems 2020 (PDF) - Get Counted (844-330-2020) - my2020census.gov - U.S. Population is around 336 Million ahead of actual count in 2020.
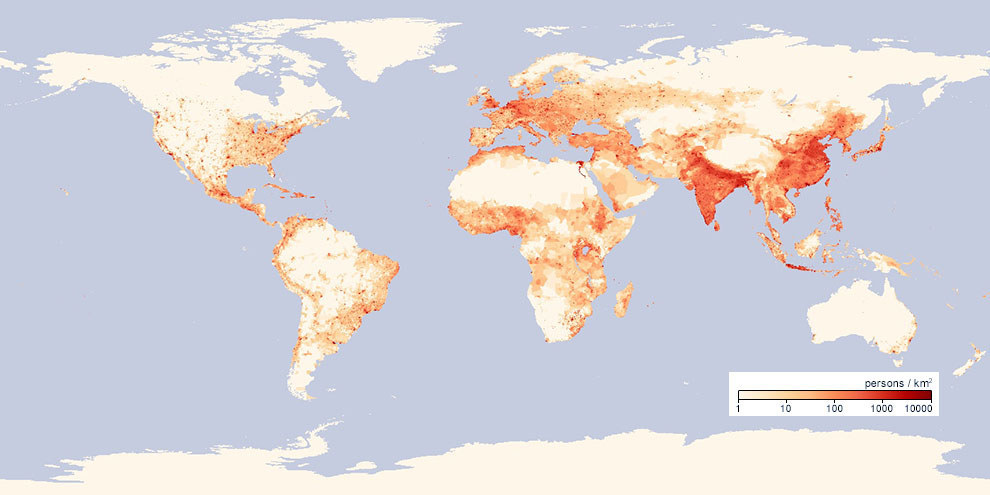
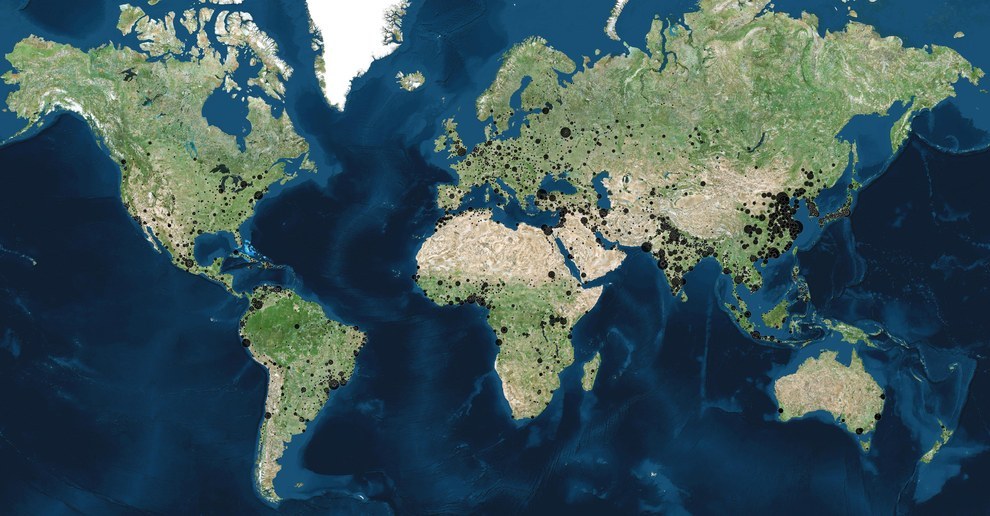
The world population grew from 1 billion to 7 billion from 1800 to 2011. It took over 200,000 years of human history for the world's population to reach 1 billion, and only 200 years more to reach 7 billion. In1960 the world Population was 3,039,451,023. In 2011 it is estimated that 135 million people were born and 57 million died, for an increase in population of 78 million. At the beginning of the 19 century there were only 12 cities in the world that had over a million people, in 2013, there is over 500 cities in the world with more than a million people. Half the worlds population lives in large cities, and if you combined all the large cities in the world, it would cover an area half the size of Australia. Human Population Through Time (youtube) .
 World Population (wiki) -
World
Population Estimates (wiki) -
Estimates of historical world population are for the progression of
world population since the late medieval period.
World Population (wiki) -
World
Population Estimates (wiki) -
Estimates of historical world population are for the progression of
world population since the late medieval period.World Population Balance - Population Data
World Stats - Demographics
Birth Rate - Death Rate - Mortality Rate
Safe Sex (not just sex education but a higher quality education for everyone)
Population Growth (wiki) - Modeling Population Growth
Research Data
 Human Lifespan is a statistical measure of the average time
an organism is expected to live, based on the year of their birth, their
current age and other demographic factors including sex.
Human Lifespan is a statistical measure of the average time
an organism is expected to live, based on the year of their birth, their
current age and other demographic factors including sex. Longevity - Living Longer
Life Expectancy Rates List (wiki) - World Life Expectancy
Mortality Rates (how people die)
Population Media Center - Thomas Robert Malthus (wiki)
One-Child Policy was introduced in China between 1978 and 1980 and began to be formally phased out in 2015.
Bloodline - Genes
How many Single People - Being Single
One in every five people on earth is between the ages of 15 and 24—that's more than 1 billion youth worldwide. 162 Million Females in the U.S. as of July 2014. The number of males was 157.0 Million.
Human Population Planning is the practice of intentionally managing the rate of growth of a human population. Historically human population planning has been implemented with the goal of increasing the rate of human population growth. Family Planning.
 Reproductive Suppression involves the prevention or
inhibition of reproduction in otherwise healthy adult individuals. It
includes delayed sexual maturation (puberty) or inhibition of sexual
receptivity, facultatively increased interbirth interval through delayed
or inhibited ovulation or spontaneous or induced abortion, abandonment of
immature and dependent offspring, mate guarding, selective destruction and
worker policing of eggs in some eusocial insects or cooperatively breeding
birds, and infanticide (see also infanticide (zoology)), and infanticide
in carnivores) of the offspring of subordinate females either by directly
killing by dominant females or males in mammals or indirectly through the
withholding of assistance with infant care in marmosets and some
carnivores.
Reproductive Suppression involves the prevention or
inhibition of reproduction in otherwise healthy adult individuals. It
includes delayed sexual maturation (puberty) or inhibition of sexual
receptivity, facultatively increased interbirth interval through delayed
or inhibited ovulation or spontaneous or induced abortion, abandonment of
immature and dependent offspring, mate guarding, selective destruction and
worker policing of eggs in some eusocial insects or cooperatively breeding
birds, and infanticide (see also infanticide (zoology)), and infanticide
in carnivores) of the offspring of subordinate females either by directly
killing by dominant females or males in mammals or indirectly through the
withholding of assistance with infant care in marmosets and some
carnivores.Family Planning - Birth Control Types
The civilized world started out with shorter lifespan and plenty of new births. Now in 2017, people in the developed world are living longer, and people in some areas are having less children. People are buying more adult diapers then children's diapers. There will be more old people then young people. We will need a work force just to take care of our elders. And since robots are taking jobs, caregiving jobs will be plentiful. Society must prepare themselves for this.
Geometric Progression is a sequence of numbers where each term after the first is found by multiplying the previous one by a fixed, non-zero number called the common ratio. For example, the sequence 2, 6, 18, 54, ... is a geometric progression with common ratio 3. Similarly 10, 5, 2.5, 1.25, ... is a geometric sequence with common ratio 1/2.
Doubling Time - Exponential Growth - Environment
Doubling Time is time it takes for a population to double in size/value. It is applied to population growth, inflation, resource extraction, consumption of goods, compound interest, the volume of malignant tumours, and many other things that tend to grow over time. When the relative growth rate (not the absolute growth rate) is constant, the quantity undergoes exponential growth and has a constant doubling time or period, which can be calculated directly from the growth rate. This time can be calculated by dividing the natural logarithm of 2 by the exponent of growth, or approximated by dividing 70 by the percentage growth rate (more roughly but roundly, dividing 72; see the rule of 72 for details and a derivation of this formula). The doubling time is a characteristic unit (a natural unit of scale) for the exponential growth equation, and its converse for exponential decay is the half-life. For example, given Canada's net population growth of 0.9% in the year 2006, dividing 70 by 0.9 gives an approximate doubling time of 78 years. Thus if the growth rate remains constant, Canada's population would double from its 2006 figure of 33 million to 66 million by 2084.
Net Reproduction Rate is the average number of offspring (often specifically daughters) that would be born to a female if she passed through her lifetime conforming to the age-specific fertility and mortality rates of a given year.
Total Fertility Rate of a population is the average number of children that would be born to a woman over her lifetime if: She was to experience the exact current age-specific fertility rates (ASFRs) through her lifetime, and She was to survive from birth to the end of her reproductive life. It is obtained by summing the single-year age-specific rates at a given time.
Films about Populations
 Cynthia Kenyon (youtube)
Mother: Caring for 7 Billion (youtube)
BBC Horizon - How Many People Can Live on Planet Earth Sustainably? David Attenborough
How Many People Can the Earth Support? (youtube)
Jared Diamond: Why Societies Collapse (video and text)
Civilizations of the Past (collapse)
The problem isn't so much over population, though it is a problem in certain areas, the main problem is education. This world could easily handle 10 billion people, as long as every person was fully educated that is. But because we have so many undereducated people at all levels of society, from the very poor to the very rich, we will always suffer from the ignorance that comes from having undereducated people. When people don't have the right knowledge and information that's needed to make good decisions and good choices, they will constantly make mistakes and not have the necessary abilities to solve problems, or even have the ability to see problems that are right in front of them.
What Happens in One Day on Planet Earth
 My parents have seen the world population
triple in their life times from 1900 till 2000. I have seen the
world population double in my lifetime since 1960 till 2015. And if I live
till 2060, I will also see the world population triple. People
being born today will not see the world population double in
their lifetimes. So is the birth rate slowing down?
My parents have seen the world population
triple in their life times from 1900 till 2000. I have seen the
world population double in my lifetime since 1960 till 2015. And if I live
till 2060, I will also see the world population triple. People
being born today will not see the world population double in
their lifetimes. So is the birth rate slowing down?
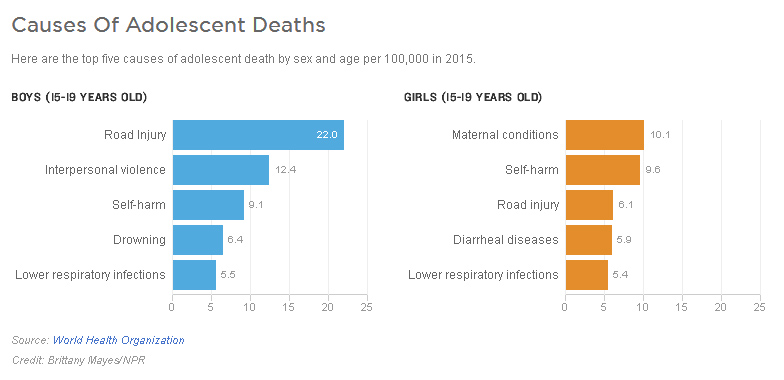
Adolescents aged 10–24 years represent over a quarter of the population (1.8 billion), 89% of whom live in developing countries. Adolescents aged 10–24 years have the poorest health-care coverage of any age group. Two-thirds of young people are growing up in countries where preventable and treatable health problems like HIV/AIDS, early pregnancy, unsafe sex, depression, injury, and violence remain a daily threat to their health, wellbeing, and life chances.
Butthole Surfers - Pepper (youtube)
"Starving peoples minds causes more damage then starving peoples physical self. Death occurs from both afflictions."
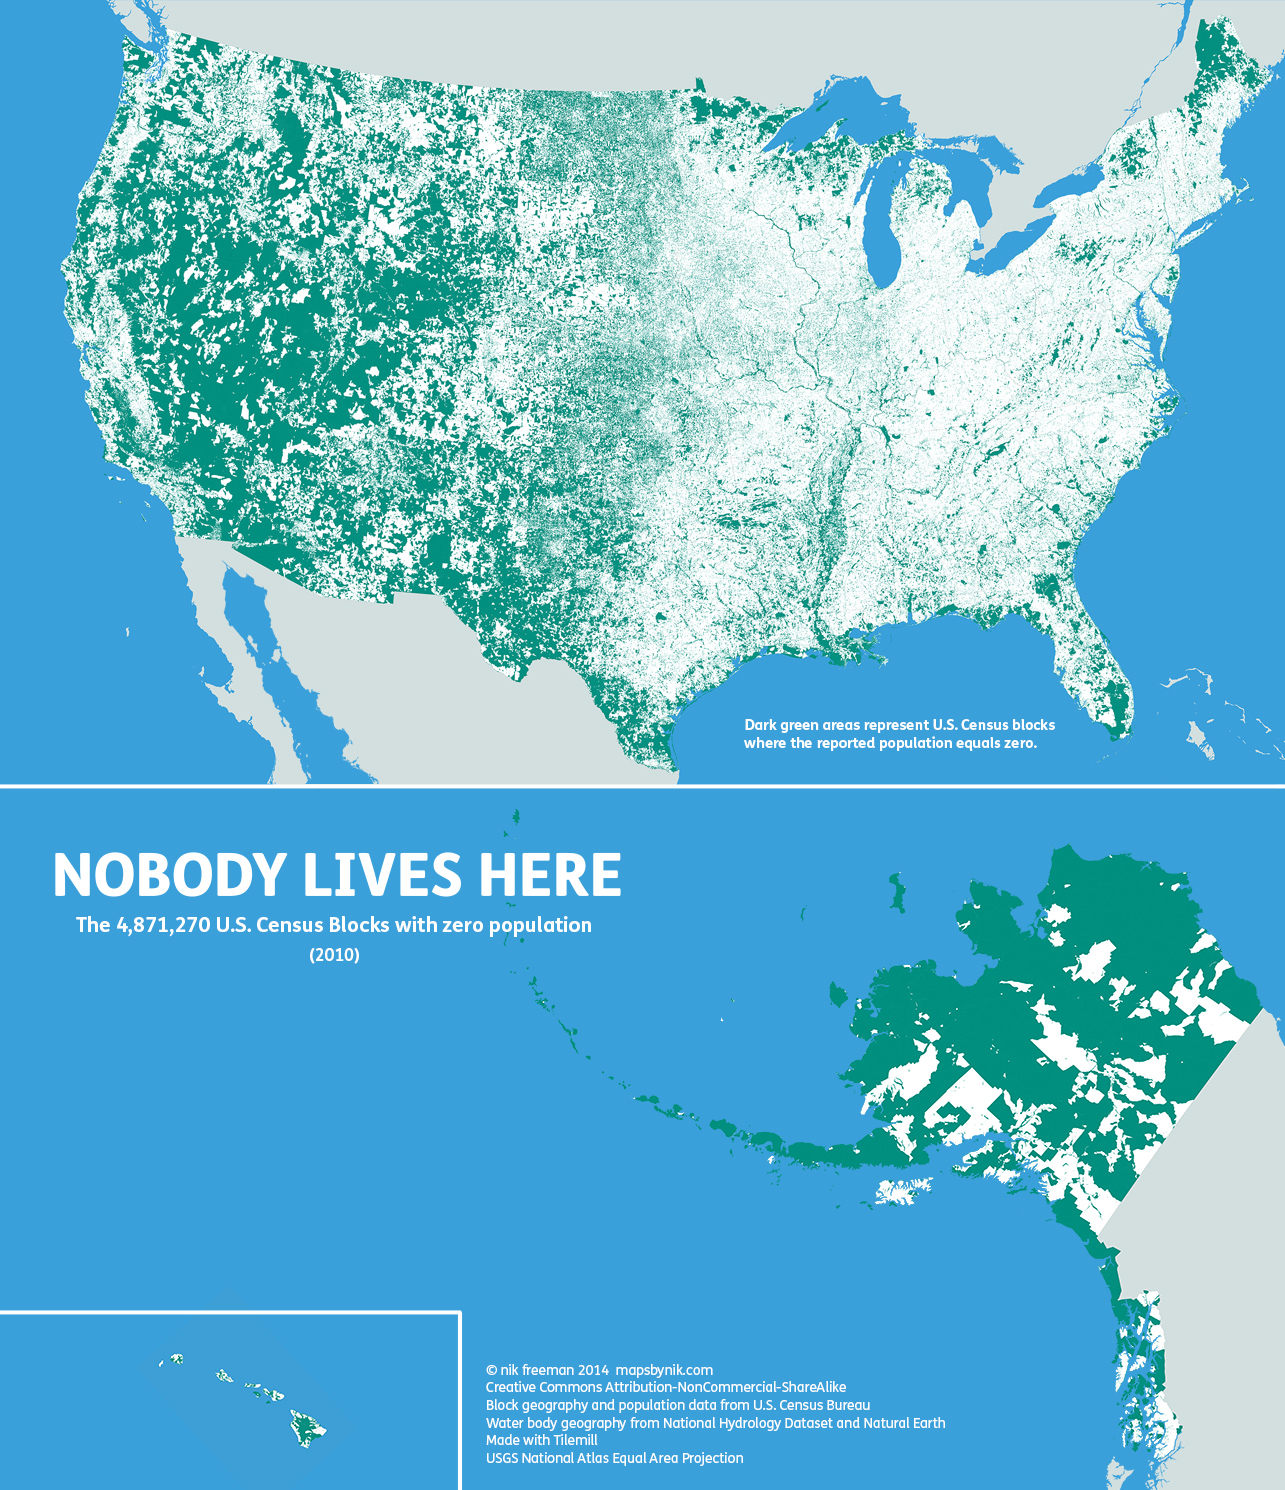
If the entire population of earth stood shoulder to shoulder (2 feet by 2 feet) we would take up around 862 square miles of land, which is the size of Midland County, Texas. There are approximately 57.5 million square miles of land on earth, which is only 29.2 percent of the earth's surface.
How much Farm Land does America need to grow our own Food?
"We are the strongest when we are together collectively, but we have to be collectively intelligent, because anything less will result in suffering, war and avoidable deaths, just as it has been and still is today."
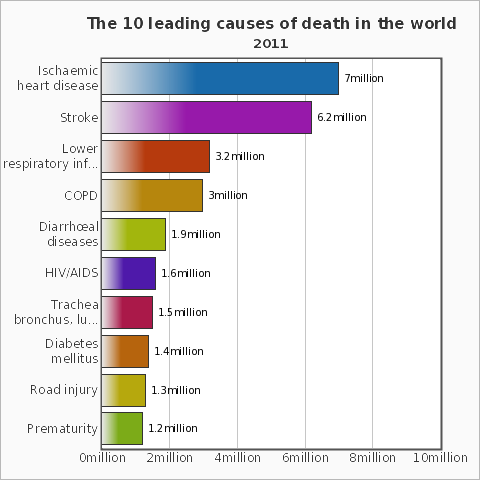
Causes of Death - Deaths Per Year - The ways that People Die
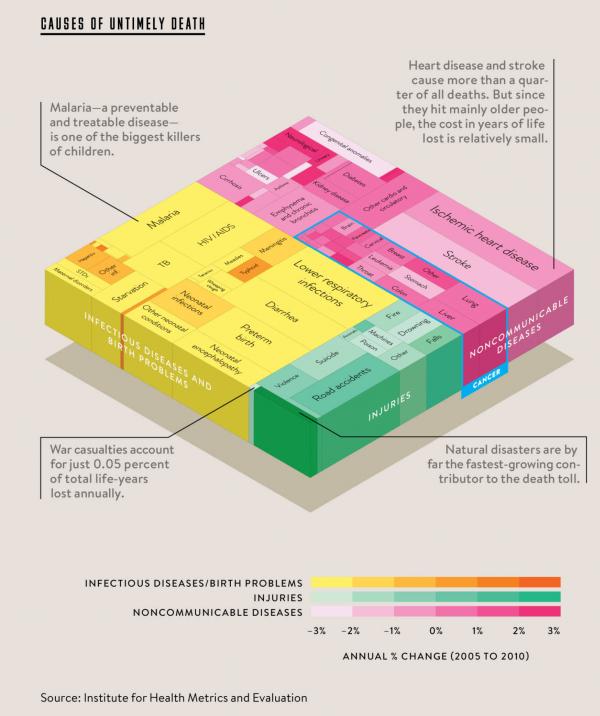
 36 million deaths each year are caused by
Non-Communicable Diseases, such as
cardiovascular disease,
cancer,
diabetes and
chronic lung diseases. This is almost
two-thirds of the estimated
56 million deaths each year
worldwide. (A quarter of these take place before the age of 60) (A non-communicable
disease is non-infectious and
non-transmissible among people).
Pollution.
36 million deaths each year are caused by
Non-Communicable Diseases, such as
cardiovascular disease,
cancer,
diabetes and
chronic lung diseases. This is almost
two-thirds of the estimated
56 million deaths each year
worldwide. (A quarter of these take place before the age of 60) (A non-communicable
disease is non-infectious and
non-transmissible among people).
Pollution.Not just Wars, Genocides and Mass Murders kill people. Roughly 385,000 people were murdered around the world in 2017.
Ignorance Kills - What people don't know is killing them. Knowledge Divide.
Let Us Remember the Fallen, let them know that their Lives meant something and that they will never be forgotten.
Tapps - by Andre Rieu Melissa Venema Amsterdam Arena (13 years old at the time). Half-Mast should be everyday.
Amazing Grace - (Lyrics) - Susan Boyle (youtube) - 2 Billion People have Died since 1960.
No one hardly ever Dies from Old Age or Natural Causes, people are being slowly mass murdered.
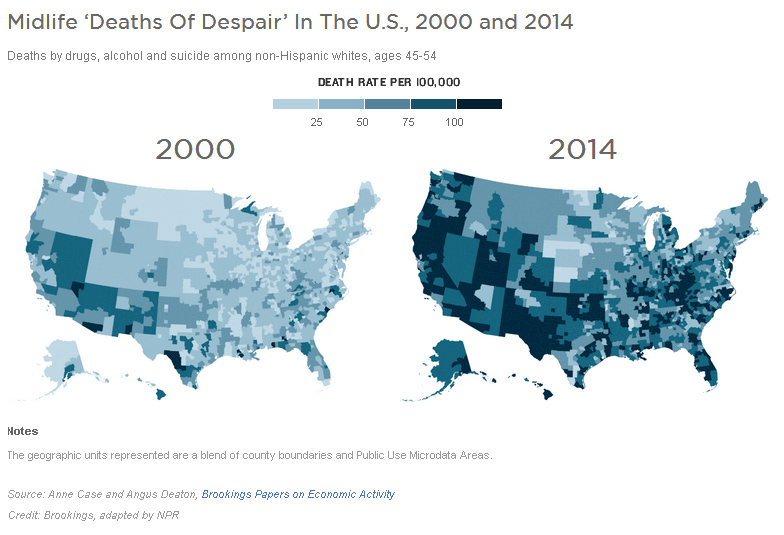
In 2015, death rates had been rising dramatically since 1999 among middle-aged white Americans. "Deaths of Despair".
 1 in 4 Deaths Avoidable
List of Preventable Causes of Death (wiki)
Consumer Protection (saving lives by informing the public of dangers)
Global Action Plan for the Prevention and Control of NCDs 2013-2020
69 Million Children under five will die from preventable causes and 167 million will suffer poverty over the next 15 years.
Over 7.5 million children under the age of 5 die from malnutrition and mostly preventable diseases, each year. Flowing Data.
Unintentional injuries are the leading cause of death for people in the United States ages 1 to 44. You're more likely to die from a lightning strike than in a plane crash and you're also more likely to die from being attacked by a dog, stung by a bee or choking on your food.
The world loses about 3,000 adolescents each day. That adds up to 1.2 million deaths a year, nearly all preventable.
Mortality Rate is a measure of the number of deaths (in general, or due to a specific cause) in a particular population, scaled to the size of that population, per unit of time. Mortality rate is typically expressed in units of deaths per 1,000 individuals per year; thus, a mortality rate of 9.5 (out of 1,000) in a population of 1,000 would mean 9.5 deaths per year in that entire population, or 0.95% out of the total. It is distinct from "morbidity", a term used to refer to either the prevalence or incidence of a disease, and also from the incidence rate (the number of newly appearing cases of the disease per unit of time).
All-Cause Mortality is utilized in reference to a disease or a harmful exposure—such as to radiation or dangerous chemicals—in a statistical context. It is typically expressed as the total number of deaths due to that condition during a specific time period.
Mortality Rates Rising for Gens X and Y, too. Reduced US life expectancy is not just the Baby Boomers.
 Death Rate -
Mortality
Death Rate -
MortalityLiving Longer - Longevity
106 Billion People have lived and died so far in human history
Mortality Risk Scores
Preventing chronic diseases: a vital investment
We have to do more then just make Laws or change laws, we need to educate.
In 2008, some 6.7 million people died of infectious diseases alone, far more than the number killed in the natural or man-made catastrophes that make headlines. (These are the latest figures presented by the World Health Organization.)
More than 3.4 million people die each year from water, sanitation.
Pollution Kills Too - Toxins - Body Burden
20,000 starve to death every day. Food Security. And thousands die every day as a result from a Bad Diet.
Some 21,000 children die every day around the world.
20,000 die from Cancer every day.
Suicide takes the lives of nearly 40,000 Americans every year. For young people 15-24 years old, suicide is the second leading cause of death.
Deaths in the United States of America, from Jan 1, 2015 - Dec 25, 2015. (numbers vary from different sources, so the numbers need to be verified).
 Heart Disease: 585,671
Cancer: 566,148
Tobacco: 343,601
Obesity: 301,388
Medical Errors: 206,161
Stroke: 126,575
Lower Respiratory Disease: 140,330
Accident (unintentional): 124,127
12,000 die every year in Mining Accidents.
Hospital Associated Infection: 97,190
Alcohol: 98,172
Diabetes: 72,481
Alzheimer's Disease: 83,421
Influenza - Pneumonia: 52,842
Kidney Failure: 41,980
Blood Infection: 32,852
Suicide: 38,796
Deaths in America due to alcohol, drugs and suicide reached a record 151,845 in 2017, Trust for America’s Health - Well Being Trust.
Driving Cars: On average in 2012, 92 people were killed on the roadways of the U.S. each day, in 30,800 fatal crashes during the year. In 2013, 10,076 people were killed in alcohol-impaired driving crashes, nearly one-third (31%) of all traffic-related deaths. 2015, 35,092 people died on the nation's roadways, an increase of 7.2 percent compared to 2014. 40,200 traffic deaths U.S. roads in 2016. 6,000 Pedestrian deaths in 2016. Thirty-four percent of pedestrians and 15 percent of drivers involved in fatal crashes were intoxicated at the time. Self Driving Cars.
List of Countries by Traffic-Related Death Rate 1.25 million deaths worldwide in the year 2010.
Nearly 1.3 million people die in road crashes each year, on average 3,287 deaths a day. An additional 20-50 million are injured or disabled. ... Road traffic crashes rank as the 9th leading cause of death and account for 2.2% of all deaths globally.
According to National Highway Traffic Safety Administration, 840 bicyclists were killed in motor vehicle crashes in 2016. The highest fatality rate was documented in Florida, with 6.7 deaths per 1 million people that year.
Texting while Driving: 5,880 - (technology addiction and abuse)
Selfie Deaths in 2017 was 93, and Selfie isn’t always officially included in cause of death. People die taking a picture of themselves either by drowning, falling into a large body of water or being swept away by waves. Other deaths included posing on the edge of a cliff and falling, accidentally shooting oneself when posing with a firearm, and attacks by animals. The rise of the “extreme selfie” phenomenon involves photographing yourself “in the most extreme environments. That apparently includes river rafting, parachuting, or posing in front of oncoming trains.
 "Since over a million more people die every
year from bad health choices then they die from
alcohol-impaired
driving crashes, police should have eating healthy checkpoints
instead of
sobriety checkpoints,
and handout
pamphlets
instead of
tickets."
"Since over a million more people die every
year from bad health choices then they die from
alcohol-impaired
driving crashes, police should have eating healthy checkpoints
instead of
sobriety checkpoints,
and handout
pamphlets
instead of
tickets."
Unintentional Poisoning: 31,177 (World 193,000)
All Drug Abuse: 24,548
Prescription Drug Overdose: 14,726.
Overdose and accidental poisonings are up 78 percent over a decade - pushing aside car crashes as the No. 1 accidental killer in the U.S. They killed 42,032 people, about 6,000 more than vehicle accidents. Opioid overdoses killed 13,486 people in 2014, the non-profit safety council reported.
Smoking in Bed: 766
Murder by Gun: 11,283
Homicide: 16,492
Pedestrian: 4,909
Drowning: 3,843 - (World 372,000)
Fire Related: 3,436
Malnutrition: 2,721
Domestic Violence: 1,433
Killed by Falling Tree: 147
Struck by Lightning: 81
Abortion: 1,072,045 ?
 Each year, 37m
Falls are severe enough
to seek medical attention, 690, 000 deaths in 2012 from falling.
Each year, 37m
Falls are severe enough
to seek medical attention, 690, 000 deaths in 2012 from falling.
Falling out of Bed: 588
Injury Facts 2016 is Your Source for Safety Data
First Aid
Heart disease: 597,689
Cancer: 574,743 ?
Chronic lower respiratory diseases: 138,080
Stroke (cerebrovascular diseases): 129,476
Accidents (unintentional injuries): 120,859
Causes of Death by Rate
Alzheimer's disease: 83,494
Diabetes: 69,071
Nephritis, nephrotic syndrome, and nephrosis: 50,476
Death Reasons
Influenza and Pneumonia: 50,097
Intentional self-harm (suicide): 38,364
Food Poisoning
Causes of Death by State
Preliminary U.S. data on deaths, death rates, life expectancy, leading causes of death, and infant mortality for 2011 (PDF)
The # 1 Reason why People Die Early, in each Country (youtube)
150,000 people will die today.
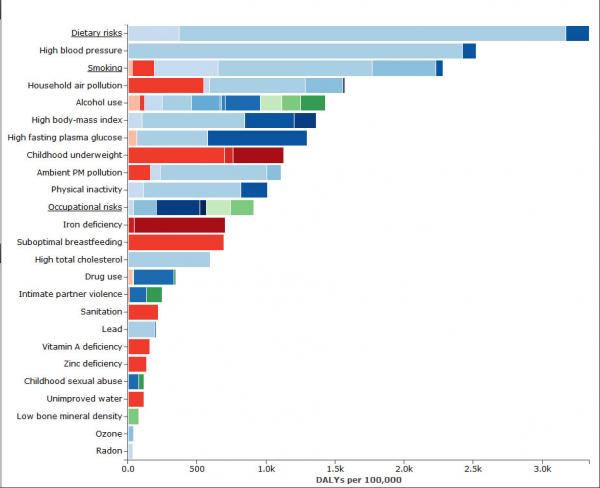
Risk Factor Study (PDF)
Even though the total number of deaths per 1,000 Population is lower now, (1900 - 17 deaths per 1,000) (2011 - 8 deaths per 1,000) there are millions more people dying each year. Yes the population has increased, but what are the real reasons why more people are dying now in 2015 then in 1900?
US healthcare costs for animal-related injuries exceed $1 billion every year. Numbers likely to rise amid climate change and development pressure on animal habitats, warn researchers. Dog bites, non-venomous insect and spider bites, and bites from venomous snakes and lizards accounted for 60 per cent of the total costs. During the five year study period, 6, 457, 534 visits were made to emergency care departments by people who had sustained injuries as a result of an encounter with creatures great and small. Their average age was 31.
Years of Potential Life Lost (actual cost of our neglect)
Injuries that white people get shows inequality or just clumsiness (image).
Democracy Linked to Global Health Gains in low-, middle-income countries. Democracies are more open to feedback from a broader range of interest groups, more protective of media freedom and might be more willing to use that feedback to improve their public health programs. Autocracies reduce political competition and access to information, which might deter constituent feedback and responsive governance. Free and fair elections for better health.
Demographics
Demography is the statistical study of populations, especially human beings which encompasses the study of the size, structure, and distribution of these populations, and spatial or temporal changes in them in response to birth, migration, ageing, and death. Based on the demographic research of the earth, earth's population up to the year 2050 and 2100 can be estimated by demographers. Demographics are quantifiable characteristics of a given population.
 Demographics
Public Data
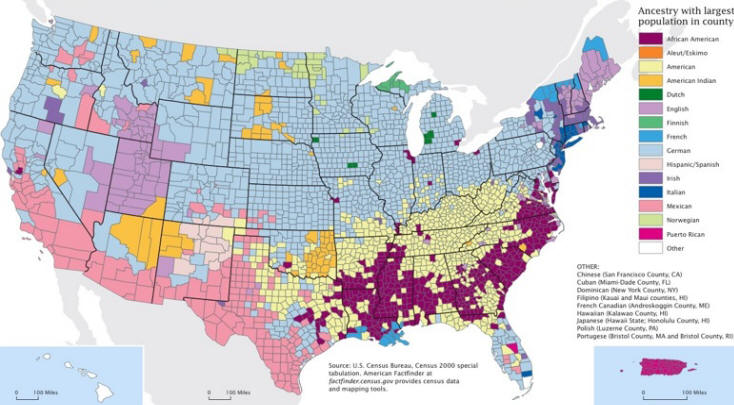
Race and Ethnicity in the United States
Demographics of the United States
Popular Last Names by State
People Still Living with Parents by State
Populations
How Many Phones?
What People Eat Around the World - School Lunches
Demographics of the United States
Population’s Age and Sex Composition 2010 (PDF) - Asian America 2011 (PDF)
5-9 years of age______ 20,348,657 __ 6.5%
10-14 years of age____ 20,677,194 __ 6.7%
15-19 years of age____ 22,040,343 __ 7.1%
5-19_____ 63,066,194 ___ 20.3%
Demographics of Young Adulthood 1975–2016 (PDF)
What If Only 100 People Existed on Earth? (youtube) - Quick look at percentages using a smaller number that represents a larger number. A clearer perspective of just some of our reality.
Census Bureau primary mission is conducting the U.S. Census every ten years, which allocates the seats of the U.S. House of Representatives to the states based on their population. The Bureau's various censuses and surveys help allocate over $675 billion in federal funds every year and it helps states, local communities, and businesses make informed decisions. The information provided by the census informs decisions on where to build and maintain schools, hospitals, transportation infrastructure, and police and fire departments. Census, as defined in Title 13 U.S.C. § 11) is a principal agency of the U.S. Federal Statistical System, responsible for producing data about the American people and economy. The Census Bureau is part of the U.S. Department of Commerce and its director is appointed by the President of the United States. In addition to the decennial census, the Census Bureau continually conducts over 130 surveys and programs a year, including the American Community Survey, the U.S. Economic Census, and the Current Population Survey. Furthermore, economic and foreign trade indicators released by the federal government typically contain data produced by the Census Bureau. The census can also be misused for gerrymandering voting districts.
One in every five people on earth is between the ages of 15 and 24—that's more than 1 billion youth worldwide.
Cohort in statistics is a group of subjects who share a defining characteristic (typically subjects who experienced a common event in a selected time period, such as birth or graduation).
Generations
Core-Based Statistical Area is a U.S. geographic area defined by the Office of Management and Budget (OMB) that consists of one or more counties (or equivalents) anchored by an urban center of at least 10,000 people plus adjacent counties that are socioeconomically tied to the urban center by commuting. Areas defined on the basis of these standards applied to Census 2000 data were announced by OMB in June 2003. These standards are used to replace the definitions of metropolitan areas that were defined in 1990. The OMB released new standards based on the 2010 Census on July 15, 2015.
People Watching
People watching or crowd watching is the act of observing people and their interactions, usually without their knowledge. It involves picking up on idiosyncrasies to try to guess at another person's story. This includes speech in action, relationship interactions, body language, expressions, clothing and activities. Eavesdropping may accompany the activity, though is not required. For some people it is considered a hobby, but for many others it is a subconscious activity they partake in everyday without even realizing.
Be Careful not to Stare at People (gawking).
People watching can be insightful and informative for authors when writing a book or actors when performing a play. Watching how other people walk, talk and interact with each other can be used as inspiration for their characters. It can also inspire other artistic works such as artwork and photography, or lead to writing a symphony, movie script or blog post. For others, people watching is a fun and relaxing activity.
Psychological Research - Inaccurate Assessments - Bias in Research
Journalism (photographing) - Cultural Studies
I find other people to be interesting. I like to learn about their experiences. Empathy is natural.
Naturalistic Observation is a research tool in which a subject is observed in its natural habitat without any manipulation by the observer. During naturalistic observation researchers take great care to avoid interfering with the behavior they are observing by using unobtrusive methods. Naturalistic observation involves two main differences that set it apart from other forms of data gathering. In the context of a naturalistic observation the environment is in no way being manipulated by the observer nor was it created by the observer. People watching is not to be confused with naturalistic observation. Naturalistic observation is used for scientific purposes. It uses the same techniques as people watching. The key is to not let anyone know that you are observing him or her. People are in their natural environment, so there is no pressure for them to behave a certain way, as they would feel if they knew they were being studied. Scientists often are fond of this method because people are acting naturally and not acting how they are expected to act. Naturalistic observation as a research tool comes with both advantages and disadvantages that impact its application. By merely observing a given instance without any manipulation in its natural context it makes the behaviors exhibited more credible because they are occurring in a real typical scenario as opposed to an artificial one generated within a lab. Naturalistic observation also allows for study of events that it is deemed unethical to study via experimental models, such as the impact of high school shootings on students attending the high school.
Body Language - Body Image
Analog Observation is a research tool by which a subject is observed in an artificial setting. Typically, types of settings in which analog observation is utilized include clinical offices or research laboratories, but, by definition, analog observations can be made in any artificial environment, even if the environment is one which the subject is likely to encounter naturally. Analog observation is typically divided into two iteration of application: The first iteration primarily studies the effect of manipulation of variables in the subject's environment, including setting and events, on the subject's behavior. The second iteration primarily seeks to observe the subject's behavior in quasi-experimental social situations. Zoos.
